DeviceBoard – Energy & Utility Management
DeviceBoard – Documentation
Energy & Utility Management Using DeviceBoard
LoRaWAN Solar Powered Gateway + DLMS-to-LoRaWAN AMRs
DeviceBoard enables a complete, scalable, cloud-based utility management solution by integrating DLMS smart meters, DLMS-to-LoRaWAN AMR modules, and a LoRaWAN Solar Powered Gateway that forwards aggregated utility data directly to DeviceBoard Cloud.
This architecture supports Smart Electricity, Smart Water, Smart Gas, and Renewable Energy monitoring across residential, commercial, industrial, and smart city deployments.
1. System Architecture Overview
DeviceBoard’s utility management ecosystem consists of:
✔ DLMS-to-LoRaWAN AMR Modules
Attached to DLMS meters to convert meter readings into LoRaWAN uplinks.
✔ LoRaWAN Solar Powered Gateway
Collects LoRaWAN AMR packets from multiple meters and forwards them to DeviceBoard Cloud.
(No network servers or wired infrastructure required.)
✔ DeviceBoard Cloud
Central platform for meter data analytics, billing automation, anomaly detection, and reporting.
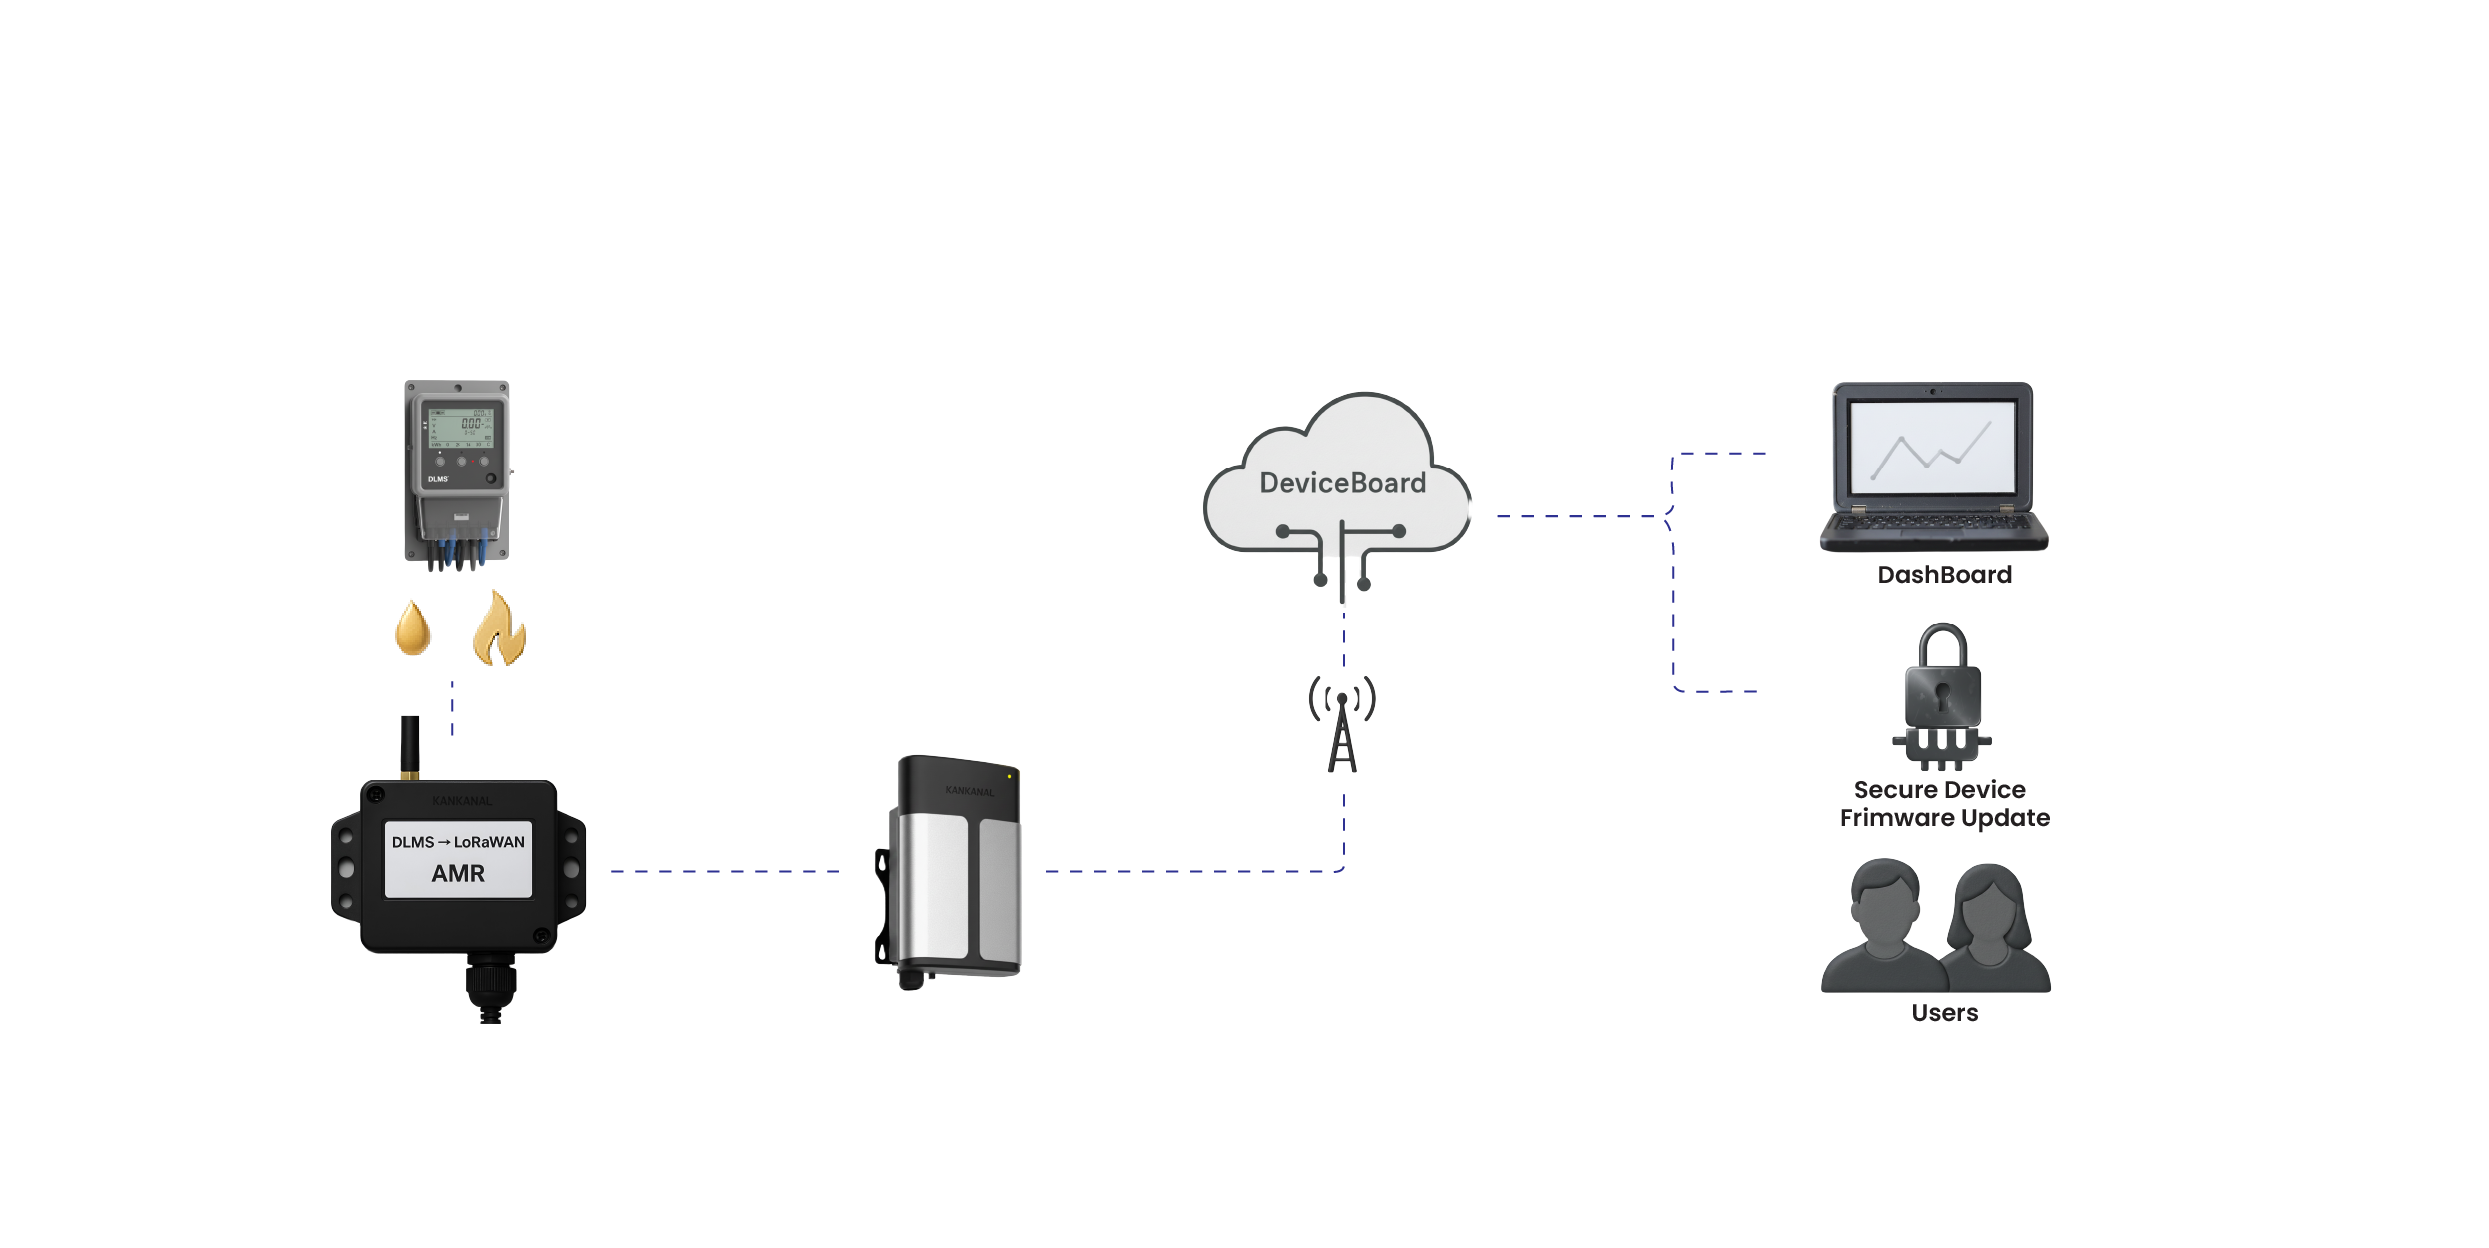
1.1 How the Data Flows
DLMS Meter → DLMS-to-LoRaWAN AMR → LoRaWAN Solar Gateway → DeviceBoard Cloud
LoRaWAN Solar Powered Gateway Responsibilities:
- Collect uplinks from multiple DLMS AMRs within a coverage zone
- Act as a private LoRaWAN Network Server at the edge
- Manage LoRaWAN join-requests & session keys
- Forward decrypted and formatted payloads directly to DeviceBoard via MQTT/HTTPS
- Operate entirely on solar power (no external wiring or grid power required)
This makes it ideal for:
- Rural utility metering
- Urban outdoor deployments
- Large residential complexes
- Industrial energy measurement farms
2. DLMS-to-LoRaWAN AMR Device Features
Each AMR device:
- Reads DLMS registers from a standard smart energy meter
- Converts values to compact LoRaWAN messages
- Sends periodic or event-based uplinks to the solar gateway
- Supports OTA updates and over-the-air configuration
- Works with multiple meter types (1P/3P, whole current, CT-operated, etc.)
3. Meter Data Collected and Sent to DeviceBoard Cloud
3.1 Electricity Meter Data
- Active energy import/export (kWh)
- Reactive energy (kVARh)
- Instantaneous voltage (R/Y/B)
- Instantaneous current (R/Y/B)
- Power factor
- Frequency
- Demand values
- DLMS event logs
- Tamper events (neutral missing, magnetic, cover open, reverse energy, etc.)
3.2 Water/Gas Meter Data
- Consumption index
- Flow rate
- Reverse flow detection
- Leak detection
- Valve status
3.3 System-Level Metadata
- Meter firmware version
- Signal strength RSSI/SNR
- AMR battery health
DeviceBoard stores all this telemetry and presents it through dashboards and reports.
4. LoRaWAN Solar Powered Gateway – Cloud Integration
The gateway communicates directly with DeviceBoard Cloud over secure protocols:
- MQTT over TLS
- HTTPS/REST
Key Functions:
- LoRaWAN packet reception and decoding
- Automatic AMR device authentication
- Meter payload parsing
- Forwarding structured JSON telemetry to DeviceBoard
- Uplink timestamping and deduplication
- Forward error correction support
Benefits:
- No wired internet required
- Zero power infrastructure (solar powered)
- Supports hundreds of AMRs in a single cluster
- Very low maintenance cost
5. DeviceBoard Features for Utility Management
5.1 Real-Time Meter Monitoring
DeviceBoard visualizes:
- Instant consumption
- Daily/Monthly usage
- Peak demand curves
- Transformer-level aggregation
- Phase imbalance analytics
- Load curve visualization
5.2 Billing Automation
DeviceBoard calculates:
- Monthly billing
- Tariff slabs (including TOD tariffs)
- Contract demand penalties
- Energy cost vs generation
- Prepaid meter balance estimation
Bills can be exported or automatically emailed to customers.
5.3 Tamper Detection & Theft Monitoring
Automated tamper alerts:
- Neutral disturbance
- Magnetic tamper
- Reverse energy flow
- Over-voltage/under-voltage
- Meter bypass detection
RulesFlow triggers immediate alarms or notifications.
5.4 Water & Gas Leak Detection
DeviceBoard uses consumption patterns to detect:
IF water_flow > expected threshold THEN leak_alert
IF gas_usage pattern erratic THEN anomaly alert
Slow leaks are detected using AI anomaly models.
5.5 AI-Based Consumption Forecasting
DeviceBoard predicts:
- Tomorrow’s energy usage
- Monthly consumption forecast
- Solar generation forecast
- Transformer loading predictions
Useful for distribution planning and demand-side management.
5.6 Renewable Energy (Solar) Monitoring
DeviceBoard supports:
- Solar inverter telemetry
- Battery storage parameters
- DC/AC conversion efficiency
- PV panel temperature
- Solar irradiance
- Grid export/import energy
Combined with AMR data, DeviceBoard shows net metering analytics.
6. Automation Workflows Using RulesFlow
Common workflows include:
6.1 Overload Management
IF load > 90% rating THEN alert substation operator
6.2 Low Solar Output Condition
IF solar_output < expected_by_AI THEN trigger performance alert
6.3 Water Leak Workflow
IF water_usage continues at night for > 60 min THEN raise leak alert
6.4 Peak Hour Control
IF usage > tariff_slab_threshold THEN recommendation to reduce load
6.5 Tamper Alert Workflow
IF tamper_event THEN create high-severity alarm + notify engineer
7. Digital Twins for Utility Assets
DeviceBoard builds Digital Twins for:
- Meters
- Solar inverters
- Transformers
- Water pumps
- Gas distribution nodes
- Aggregation zones
Each twin includes:
- Realtime attributes
- Telemetry
- Fault logs
- Consumption curves
- Predictive health score
- AI anomaly insights
8. Utility Dashboards in DeviceBoard
✔ Electricity Consumption Dashboard
- Real-time load
- Phase voltage graphs
- Daily/Monthly consumption
- Peak alerts
✔ Water/Gas Dashboard
- Usage trends
- Leak detection heatmaps
- Top consumers
✔ Solar Energy Dashboard
- PV output
- Battery charge
- Efficiency score
- Weather vs generation correlation
✔ Distribution Monitoring Dashboard
- Transformer load
- Feeder performance
- Consumption by zone/user group
✔ Billing Dashboard
- Tariff slabs
- Meter-wise billing
- Pending invoices
All dashboards can be auto-generated using Natural Language Insights.
“Show me today’s total energy consumption by area.”
9. Reports & Compliance Documentation
DeviceBoard generates:
- Daily consumption reports
- Monthly billing reports
- Tamper event logs
- Solar performance reports
- Leak audit reports
- Feeder analysis
- Net metering summaries
Reports can be scheduled or exported to PDF/Excel.
10. Use Cases Supported
✔ Smart Electricity Metering
✔ Smart Water Metering
✔ Gas Metering & Safety
✔ Solar Power Plants
✔ Smart Apartments & Townships
✔ Industrial Parks
✔ Agricultural microgrids
✔ Smart Cities Utility Monitoring
11. Benefits of Using DeviceBoard for Utility Management
| Benefit | Description |
|---|---|
| Zero manual meter reading | Fully automated AMR via LoRaWAN |
| Energy cost savings | AI anomaly + peak demand control |
| Minimal infrastructure | Solar-powered gateways, no wiring |
| Scalable | Thousands of meters per deployment |
| Tamper-proof operations | Theft & tamper detection |
| Better planning | Consumption forecasting & analytics |
| Unified platform | Electricity, water, gas, solar in one place |
| Cloud native | Easy access from anywhere |